Pizza Sales Dashboard Analysis
Exploring pizza sales data to uncover actionable business insights using Excel & SQL
Project information
- Category: Data Analytics / Excel + SQL Project
- Client: Personal Project
- Project date: 17 May, 2025
- Project URL: github.com/Qiamazen
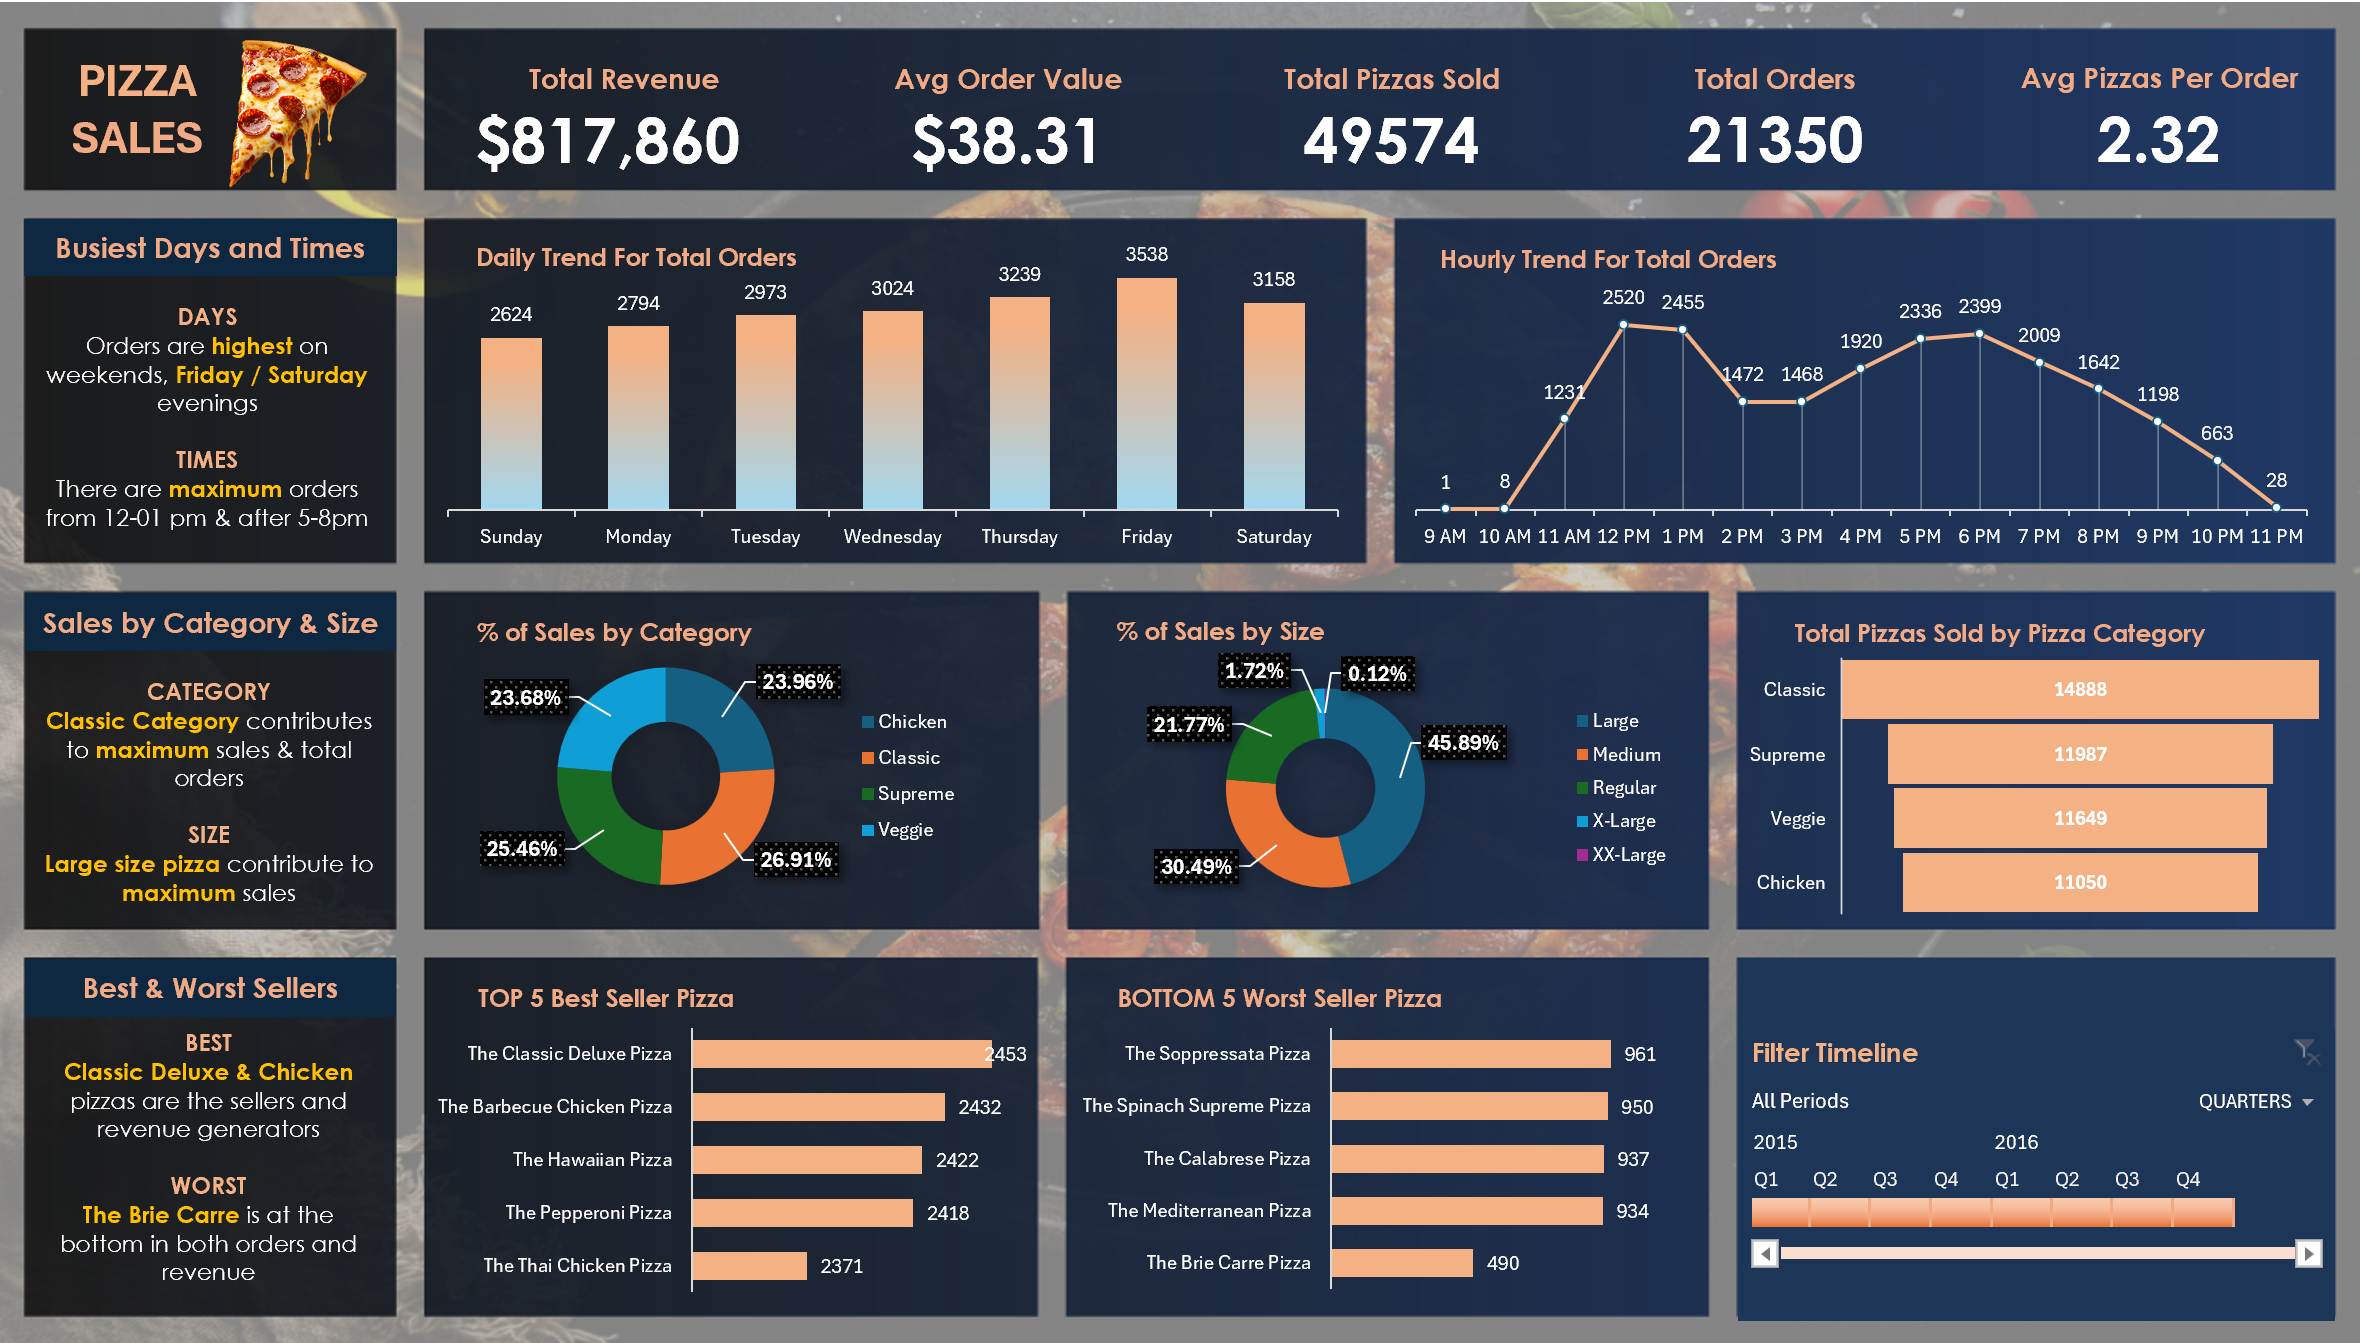
Pizza Sales Performance Analysis Using Excel & SQL
This project involved analyzing pizza sales data to uncover actionable business insights. Excel was used extensively for data preparation, transformation, and dashboard creation, while SQL was used in parallel to ensure accuracy by cross-validating key metrics such as total revenue, number of orders, and average order value.
Skills & Tools: Excel, SQL, Data Cleaning, Dashboarding, Business Analysis
Key Insights:
- Cleaned and transformed raw sales data in Excel using Power Query
- Verified key metrics using SQL queries to ensure consistency across platforms
- Identified peak sales times (Fridays/Saturdays and afternoon/evening hours)
- Revealed the top-performing pizza categories and sizes, highlighting the dominance of Classic and Large-size pizzas
- Provided business recommendations based on top and bottom-selling products
- Built an interactive Excel dashboard with key KPIs like total revenue, orders, and average order value
Example Visuals:
- Clustered bar charts for daily/hourly sales trends
- Donut charts showing sales breakdown by category and size
- Rankings for best and worst-selling pizzas
- Timeline slicer for filtering data by time period